Every week, your phone sends you a screen time report. Most of us glance at the big number, wince, and swipe it away. Nothing changes.
There’s a good reason to look closer. People are surprisingly bad at guessing their own phone use. A large review in Nature Human Behaviour found that self-reported screen time rarely matched what devices actually logged. Your report is the one honest record you have.
The catch is that the headline hours figure is the least useful part. Three smaller numbers tell you far more about the habit behind it, and they’re much easier to change.
This guide shows you where to find your report, which three metrics to focus on, how you compare with people your age and in your line of work, and how to set a target you’ll actually hit.
Quick Takeaways
- Your daily average mixes work, maps and music with mindless scrolling. On its own, it says little.
- Pickups, notifications, and the first app you open after a pickup show the habit loop.
- US adults average about 186 phone pickups a day.
- Batching notifications three times a day has been shown to cut unlocks and improve focus.
- Set one small target for one metric, not a big cut to total hours.
Where to Find Your Screen Time Report
On iPhone: open Settings > Screen Time, then tap See All App & Website Activity. Switch between Week and Day at the top. Scroll down to find Most Used, Pickups, and Notifications. Apple’s Screen Time guide covers the settings in more detail.
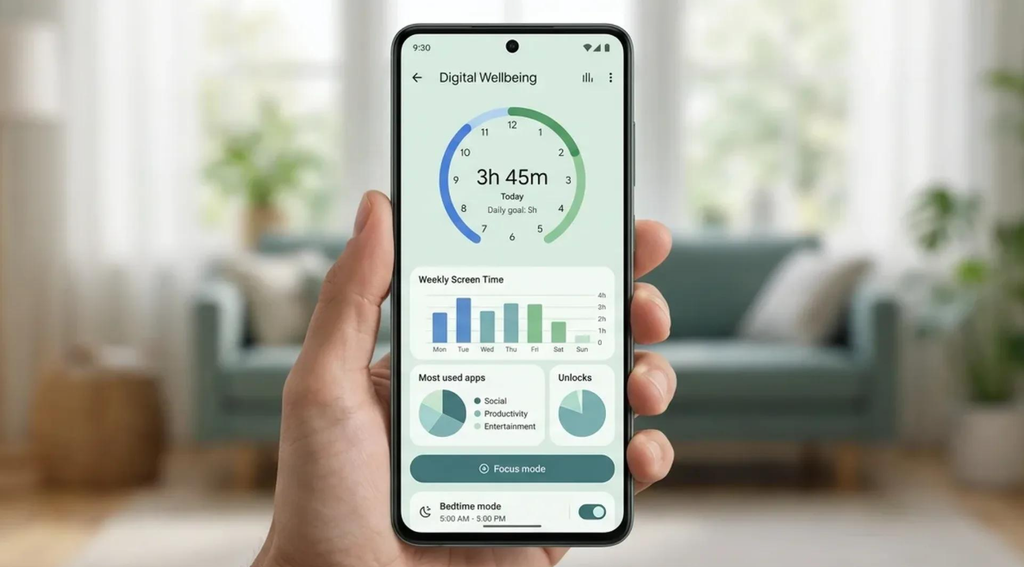
On Android: open Settings > Digital Wellbeing & parental controls. The dashboard shows screen time, notifications received, and how often you unlock your phone or open each app. Samsung phones use their own version, so menu names can vary. Google’s Digital Wellbeing help lists the options.
Tip: look at the weekly view first. Daily numbers swing a lot. A week smooths out one long train ride or a sick day on the couch.
Why the Big Number Misleads You
Your daily average is a blend. It counts the 40 minutes you spent on Google Maps, the podcast playing while you cooked, and the video call with your parents. It also counts the hour you lost to short videos at midnight.
That’s why the same number can mean very different things. Four hours of reading and navigation is not the same as four hours of scrolling. Cutting “screen time” in general also feels vague, so most people don’t know where to start.
The weekly change percentage has the same problem. A 12% rise might be a busy work week, not a slipping habit.
A quick way to clean it up is the category view. Both iPhone and Android group apps into types such as social, entertainment and productivity. Mentally subtract the categories you’re happy with, and you’ll see how much time is really the habit you want to change.
So use the big number as context, not as the goal. The real clues sit lower down the report.
The 3 Metrics That Actually Matter
These three numbers describe the loop that drives most unplanned phone use: something pulls you in, you pick up the phone, and one app swallows the next few minutes. Change any part of that loop, and the total tends to follow.
1. Pickups
Pickups (or unlocks on Android) count how often you reach for your phone. This is the purest measure of habit, because each pickup is a small decision you often don’t notice making.
For context, Reviews.org’s 2026 survey found that US adults pick up their phones 186 times a day, roughly 12 times an hour while awake.
Why it matters: pickups respond well to friction. In the PNAS study of the one sec app, a short pause before a chosen app opened cut app openings by 57% over six weeks. Fewer openings usually means less total time, without needing willpower for every minute.
What to look for: your hourly pattern. Most reports show when pickups cluster. Spikes in the first hour after waking or late at night are often the easiest to target. A brief check-in at those moments, the kind ComfortZoneCheckin is built around, can be enough to break the reflex.
2. Notifications
Notifications show how often your phone pulls you in, rather than you reaching for it. Many pickups start here.
The research is clear that timing matters more than total silence. In a randomized trial, people whose notifications arrived in three batches a day felt more attentive and productive, were in a better mood, and felt more in control of their phones. They also unlocked their phones less. Turning notifications off completely backfired: that group felt more anxious and worried about missing out. Batching once an hour made little difference.
What to look for: the top three apps sending notifications. If one of them isn’t from a person who needs you, mute it or move it to a scheduled summary. On iPhone, the Scheduled Summary setting delivers non-urgent alerts at set times.
3. First App After Pickup
iPhone reports show which apps you open first after a pickup. On Android, the times-opened count per app gives a similar picture.
This is your trigger app: the one your thumb heads for on autopilot. It’s often a social or video app, but it can just as easily be email or news.
What to look for: if one app leads by a wide margin, that’s your single best place to add friction. Move it off your home screen, put it in a folder on the last page, or add a short delay. The goal isn’t to ban the app. It’s to make the first tap a choice rather than a reflex.
Screen Time Benchmarks by Age and Job
Benchmarks help you see whether your report is typical or an outlier. Here’s what recent surveys show by age group.
| Group | Typical daily screen use | Typical daily pickups | Source |
| Tweens (9–12) | About 5 hours (entertainment, all screens) | Not measured | Common Sense Media, 2026 |
| Teens (13–17) | About 8 hours (entertainment, all screens) | Not measured | Common Sense Media, 2026 |
| Gen Z adults | 4h 6m (phone) | 112 | Reviews.org, 2026 |
| Millennials | 3h 57m (phone) | 186 | Reviews.org, 2026 |
| Gen X | 3h 5m (phone) | 196 | Reviews.org, 2026 |
| Baby Boomers | 2h 8m (phone) | 224 | Reviews.org, 2026 |
A few notes on reading this. The teen and tween figures come from the 2026 Common Sense Media Census, which also found that more than 4 in 10 teens spend 10 or more hours a day on entertainment screens. Those numbers include TV and gaming, not just phones. For a closer look at one age, see our guide on screen time for a 12-year-old.
Notice the adult pattern too. Gen Z spends the most time on their phones but picks them up the least. Boomers pick up most often in shorter bursts. Your fix depends on which pattern you match: long sessions need time limits, while frequent pickups need friction.
Starting Targets by Job Type
There’s no reliable dataset of phone use by occupation, so the table below gives starting points, not statistics. They focus on leisure phone use, since work screens shouldn’t count against you.
| Your work | What to ignore in your report | Metric to watch | Sensible first target |
| Desk or remote job | Work apps, email during work hours | Pickups during work hours | Cut work-hour pickups by about a fifth |
| Shift, field or trade work | Navigation and job apps | Social time on breaks and after shifts | Keep one break per shift phone-free |
| Student | Study and learning apps | Notifications during study blocks | Batch notifications outside study hours |
| Parent at home | Calls, messages, family logistics | First app after pickup | Move your trigger app off the home screen |
| Social media or creator role | Posting and analytics tools | Personal scrolling outside work hours | Set a clear end time for work apps |
How to Set a Realistic Screen Time Target
Big targets fail. “Cut screen time in half” collapses by Wednesday. Small, specific targets on one metric hold up much better.
- Record a baseline week. Don’t change anything. Just note your weekly average, daily pickups, top notification sources, and first app after pickup.
- Pick one metric. Choose the one that stands out most against the benchmarks above. Ignore the rest for now.
- Set a small, specific target. For example: 20 fewer pickups a day, mute two notification sources, or move one trigger app off the home screen. Cutting about 10 to 20% is a reasonable first step. It’s noticeable but doesn’t feel like a punishment.
- Change the environment, not just the goal. Targets work better with a tool behind them. Use Scheduled Summary for notifications, a delay app for pickups, or a blocker for your trigger app. Our list of apps to limit screen time covers the options.
- Check the report once a week. Compare the same weekday or the full week. Daily checking tends to create guilt rather than change.
- Lock it in, then move on. After two or three steady weeks, keep the change and pick the next metric.
What to Do When Your Report Gets Worse
Some weeks your numbers will rise. That’s normal. Travel, illness, deadlines and holidays all push screen time up.
Before you react, check the cause. If the rise came from maps, work apps or video calls, ignore it. If it came from your trigger app or a jump in pickups, go back to step 3 and tighten one setting.
One bad week doesn’t erase a trend. Look at the last four weeks together, not just this one.
FAQ
For US adults, recent survey data puts phone time at roughly 2 to 4 hours a day, depending on age. That’s about 15 to 29 hours a week on the phone alone. Total screen time across all devices is higher.
Go to Settings > Screen Time > See All App & Website Activity. Use the Week view, then focus on Pickups, Notifications, and the first apps used after pickup, rather than just the total.
Not necessarily. Check which apps drove the increase. A rise from work or navigation apps isn’t a habit problem. A rise in pickups or time on your trigger app is worth acting on.
Most people misjudge their phone use, and research shows self-estimates are often far off. Your report is based on logged data, so trust it over your gut, while remembering it counts useful time too.
On Apple devices, yes. Turn on Share Across Devices in Screen Time settings, and your report combines iPhone, iPad and Mac use signed in to the same Apple Account. Android’s Digital Wellbeing reports cover one phone at a time.